Throughput and PLR measurements are made with Alantec PowerBits testers which integrate traffic generator and packet counter functions in a single product. The general test setup topology for Ethernet-to-Ethernet testing is shown in Figure 7a. Throughput and PLR are measured for a single Ethernet stream and for multiple streams up to the limit imposed by the number of ports on the switch or by the test setup. For example, a 16-port switch can support a maximum of eight Ethernet streams. The test setup is limited to a maximum of 30 Ethernet streams, allowing any switch with 60 or fewer ports to be tested to its maximum capacity.
For each stream the tester forwards a 30-second burst of traffic at up to the theoretical wire speed of Ethernet for a given packet size (e.g., 14,880 packets per second for minimum-sized 64-byte packets; separate tests are run for packet sizes ranging from 64 to 1,518 bytes). After the packets are forwarded by the switch back to the tester, comparisons are made to determine the forwarding rate, throughput and PLR of the switch for the number of streams and packet size in question.
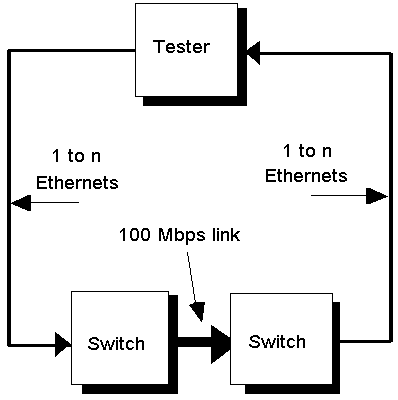
Ethernet-to-Ethernet via FDDI or Ethernet-to-Ethernet via Fast Ethernet throughput and PLR are measured in the test setup modified as shown in Figure 7b. In this case, two identical switches are connected back-to-back via high-speed ports, and multi-stream Ethernet throughput and PLR via the 100 Mbps port is determined by the same procedures used for Ethernet-to-Ethernet testing. With unidirectional Ethernet traffic a maximum of 10 Ethernet streams consumes the full 100 Mbps bandwidth. For bidirectional traffic testing over a half duplex Fast Ethernet or simplex FDDI connection, a maximum of five streams of traffic can flow in each direction. If the switch under test supports full duplex operation on its high-speed ports and has a sufficient number of Ethernet ports, bidirectional performance can be tested up to a maximum of 10 Ethernet streams in each direction.
For switches with multiple high-speed ports, performance of Ethernet-to-Ethernet via a 100/100 switched link can be measured by adding a third switch to the test setup, as shown in Figure 7c. Again the symmetry of the test setup allows the same Ethernet-to-Ethernet test suites to be used to determine switching performance over the higher speed link.
Forwarding rate is defined as the maximum rate at which the switch can process and forward packets irrespective of packet loss. For unidirectional tests, there are no collisions, and the forwarding rate is determined entirely by the switch itself. In the case of bidirectional Ethernet traffic over a given link, collisions occur and reduce the maximum forwarding rate to the 60 to 65% range that is generally regarded as the maximum practical utilization of an Ethernet segment with two-way traffic consisting of small packets.
Throughput is defined as the maximum rate at which the switch can forward packets without packet loss. This maximum rate is determined by a binary search procedure that starts at 50% of the theoretical rate and increments and/or decrements forwarding rate until the maximum lossless rate is found. The standard test suites measure unidirectional traffic for the maximum number of streams the switch can support from the following range of possibilities: 1 to 6, 8, 10, 12, 16, 20, 24, 30 streams. Additional stream counts may be included as dictated by characteristics of the high-speed LAN technology under test.
PLR is defined as the percentage of packets forwarded by the tester that were not returned by the switch within an expected window of time. Packet loss is generally due to buffers overflowing because packet processing does not empty buffers as fast as they are being filled. In addition, packets that are delayed beyond the measurement window will be considered as "lost" by the tester in spite of the fact that they may not have been dropped. PLR is measured by a different procedure than the one used for throughput: for each packet size and number of streams the offered load is stepped down from 100% of the maximum theoretical rate in steps of 10%. The percentage of forwarded packets that is lost by the switch is recorded until the number of packets lost is zero for two successive levels of offered load.
For all of the unidirectional performance test results presented in this report, traffic flows unidirectionally from the tester to the switch and back again. Traffic received by each input port on the switch under test is distributed across all of the output ports to simulate a typical traffic pattern. In addition a number of bidirectional Ethernet-to-Ethernet tests were run in an attempt to simulate "real world" Ethernet environments in which collisions place limits on the maximum utilization of an Ethernet segment. In these tests, the PowerBits tester determines the maximum forwarding rate and the PLR by attempting to forward 50% of a theoretical maximum stream in each direction and then reducing the load in 10% decrements until no packet loss is observed for two consecutive trials.
Bidirectional throughput/PLR for Ethernet-to-Ethernet via FDDI or via Fast Ethernet and for Ethernet-to-Ethernet via FDDI-to-FDDI or via Fast Ethernet-to-Fast Ethernet was also measured for some of the switches in the evaluation. Whether or not the test was run was determined by a combination of vendor discretion and availability of high-speed ports on the switch. The setups for these tests had topologies identical to the unidirectional tests, except that the traffic flow was divided so that one half of the streams flowed in each direction. In all cases, the traffic was split in such a way as to avoid collisions on both the Ethernet feeder links and the Fast Ethernet links. For Fast Ethernet, collisions were eliminated through the use of full duplex links. Where full duplex high-speed links were provided by the vendor, throughput/PLR was tested for bidirectional traffic up to 10 Ethernet streams in each direction .
Click here for Picture FIGURE 7A. ETHERNET-TO-ETHERNET THROUGHPUT, FORWARDING RATE/PLR TEST SETUP
Click here for Picture FIGURE 7B. ETHERNET-TO-ETHERNET VIA 100 MBPS LINK THROUGHPUT/PLR TEST SETUP
Click here for Picture FIGURE 7C. ETHERNET-TO-ETHERNET VIA 100 MBPS-TO-100 MBPS THROUGHPUT/PLR TEST SETUP
Congestion can occur in LAN switches when more than one input port is contending for a single output port or when a high-speed input port is forwarding traffic to a single, lower speed output port. If the level of congestion is high and lasts for a period of time, packets can be lost due to overflowing buffers that serve the port under contention.
The most common design approaches to dealing with congestion are to dedicate large buffers to input/output ports or to dynamically allocate a shared buffer pool to a group of ports. For Ethernet-to-Ethernet switches the effectiveness of such passive approaches to congestion tolerance is determined by measuring the maximum number of back-to-back packets that can be directed to a single output port without packet loss. The test setup for this measurement is shown in Figure 8. The PowerBits tester forwards back-to-back packets to multiple input ports on the device under test, which switches all incoming traffic to a single output port. The second switch is used to maintain symmetry in the test setup. The test is run for the full range of packet sizes from 64 to 1,518 bytes.
A more proactive approach to dealing with congestion is to attempt to eliminate frame loss within the switch by applying "back pressure" to those end stations or segments that are consuming most of the switch buffer capacity. One way of accomplishing this is for the switch to issue an Ethernet "jam" signal when buffers fill beyond a design threshold level. Jam signals normally are the result of collision detection. When the sending end systems on the segment receive the jamming signal, they will back off for a random time period before attempting a retransmission. Another way of creating back pressure is for the switch to raise the Ethernet carrier signal delaying transmission by the end stations. The best test of the effectiveness of these active congestion control mechanisms is to measure the forwarding rate and PLR over the single output port as a function of the offered load of several input streams. Ideally, the back pressure mechanism will throttle back the input ports to allow the output port to be just barely saturated at 100% of a theoretical stream, and the switch will be able to accomplish this without dropping packets.
The test setup for this measurement has the same topology as for the passive congestion tests. In this case, however, the PowerBits tester forwards normal forwarding rate/PLR test streams to the input ports of the switch, and the aggregate count of packets sent and packets received are compared. The test is run for the full range of packet sizes from 64 to 1,518 bytes.
Click here for Picture FIGURE 8. CONGESTION TOLERANCE/CONTROL TEST SETUP
For 10/100 switches congestion can also result from long bursts of traffic from a 100 Mbps input port directed at a single 10 Mbps output port. A separate test to measure congestion performance for this scenario was not run because lack of availability of 100 Mbps testers and because it was decided that the results would be very similar or identical to those of the Ethernet-to-Ethernet congestion tests. For switches that use passive congestion tolerance, the results depend only on the degree to which the output port is oversubscribed, not on whether the traffic is derived from Ethernet or 100 Mbps input ports. For switches using active, back pressure congestion control the same reasoning holds. Of course, back pressure congestion control based on collisions can be applied only to Ethernet and Fast Ethernet input ports.
Latency is measured in a test topology similar to the one for the throughput/PLR tests. In this case, however, the tester is a NetCom SmartBits, which is capable of measuring latency to an accuracy of 100 nanoseconds (0.1 microseconds, which is 1 bit-time on Ethernet).
Latency is the time it takes for a networking device to process a data frame. For switches that store, process and then forward incoming frames, latency is measured as the elapsed time between receiving the last bit of the incoming packet and transmitting the first bit of the resulting outgoing packet (LIFO latency). For cut-through switches or fragment-free cut-through switches, the processing delay or latency is the elapsed time between receiving the first bit of the incoming packet and transmitting the first bit of the resultant outgoing packet (FIFO latency). While some switches in the evaluation support store-and-forward operation for both 10/10 and 10/100 switching, a number of switches support or offer the option of cut-through 10/10 switching for unicast packets. When a switch is configured for cut-through 10/10 switching it may also cut-through when switching 100-to-10 Mbps and 100-to-100 Mbps (in switching from 10-to-100 Mbps, the full packet must be received at 10 Mbps and stored before the 100 Mbps transmission can begin). In comparing the latency results of cut-through switches and store-and-forward switches, one must look at the incremental transit delay caused by the switch as explained in Section VI of the report under Interpretation of Latency Results. In essence, one must add the packet transmission time to the LIFO latency of store-and-forward switches and compare this to the FIFO latency of cut-through and fragment-free switches.
In the Strategic Networks 10/100 Ethernet Switching tests, latency is measured as the processing delay of a tagged packet in the middle of a stream of 100 packets (at 100 pps) between a pair of ports. For each latency test, latency is measured for 15 separate trials. After outlier data has been discarded, the results of the 10 remaining trials are averaged, and the variation in latency (defined as the maximum less the minimum over the 10 trials) is calculated. The test is run for the full range of packet sizes from 64 to 1,518 bytes.
Three separate series of latency tests are performed: 1) unicast packet latency and broadcast packet latency for Ethernet-to-Ethernet switching, 2) unicast packet latency and broadcast packet latency for Ethernet-to-Ethernet via 100 Mbps switching, and 3) unicast packet latency and broadcast packet latency for Ethernet-to-Ethernet via 100 Mbps-to-100 Mbps switching (only switches submitted with multiple 100 Mbps ports can participate in the latter test series).
The test setup topologies for unicast and broadcast latency are shown in Figures 9a, 9b, and 9c. In considering the latency of Ethernet-to-Ethernet via FDDI or via Fast Ethernet, it is extremely important to realize that the measurements presented are the total latency encountered in passing through two switches. In other words the pair of switches and the LAN between them is considered as a single store-and-forward unit. Therefore, the LIFO latency measurement taken includes the sum of a 10/100 switch latency and a 100/10 switch latency, plus the packet transmission time over the 100 Mbps LAN. The two switch latencies may not be the same: in fact, some Ethernet-to-Fast Ethernet switches, including the 3Com LinkSwitch 1000 and the Cisco Catalyst 2100, use store-and-forward mode for Ethernet-to-Fast Ethernet switching but can at the same time use cut-through or fragment-free mode for Fast Ethernet-to-Ethernet switching. To calculate the total LIFO latency of two store-and-forward switches, one could subtract out the Fast Ethernet packet transmission times of 5.12 microseconds for 64-byte packets and 121.4 microseconds for 1,518-byte packets.
In the case of the latency of Ethernet-to-Ethernet via FDDI-to-FDDI or via Fast Ethernet-to-Fast Ethernet, the situation is quite similar. Here, however, the latency measured is the total delay through three switches, plus the delay for two packet transmissions over the high-speed LAN, as shown in Figure 9c. Again, Ethernet/Fast Ethernet switches configured in cut-through mode will use cut-through for Fast Ethernet-to-Fast Ethernet switching and for Fast Ethernet-to-Ethernet switching. This can trim some of the high-speed LAN transmission time from the latency measured.
For modular switches, Ethernet-to-Ethernet unicast and broadcast latencies are measured in two circumstances: 1) where the input and output ports are on the same module (latency "within" the module) and 2) where the input and output ports are on separate modules (latency "between" modules). For fixed configuration switches, all ports are regarded as "within" the same module. Broadcast latencies are measured across one input port and up to 18 output ports in order to determine whether broadcast latency is dependent on port number/location (see Figure 9a).
Click here for Picture FIGURE 9A. ETHERNET-TO-ETHERNET UNICAST AND MULTIPORT BROADCAST LATENCY TEST SETUP
Click here for Picture FIGURE 9B. ETHERNET-TO-ETHERNET VIA 100 MBPS LATENCY TEST SETUP
Click here for Picture FIGURE 9C. ETHERNET-TO-ETHERNET VIA 100 MBPS-TO-100 MBPS LATENCY TEST SETUP
The Strategic Networks Switched 10 Mbps-100 Mbps Evaluation includes two tests that verify compliance to network management standards. The underlying philosophy behind these tests is that vendors of internetworking devices should provide SNMP agents that comply strictly with Internet Engineering Task Force (IETF) standards. This allows the device to be managed with network management applications from third-party vendors rather than requiring a special application that is specific to a single vendor. This philosophy does not preclude the vendor from creating an extensive private management information base (MIB) with special applications that are designed to use these additional variables to add value to the standards, as long as private MIB variables are not substituted for variables that are called for in the public MIBs.
The MIB Verification Test scans the switch MIB to verify that all the variables designated as mandatory in MIB-II (RFC 1213) and the Bridge MIB (RFC 1493) are included in the switch's public MIB. The results are reported in terms of both the "missing" variables and the "extra" variables. Extra variables may include additional standard MIB variables beyond those that are strictly demanded, as well as enterprise-specific variables that the vendor has added to support special features of the switch.
The MIB Accuracy Test verifies the accuracy of some of the counter variables specified in the above MIB standards and the SNMP MIB. The test is performed by reading out the counters both before and after a precise number of packets is forwarded through the switch. A particular switch could fail the MIB Accuracy Test if the counter variable is a) present but not properly incremented, b) missing altogether or c) displaced by one or more variables in the enterprise-specific private MIB extensions.